The following data was collected at the Big Bang London Science Fair as part of a stand run by Mathscareers.org.uk
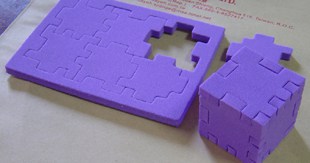
Pupils competed in groups of around 5 students to try and assemble a cube puzzle. The maximum time allowed was 5 minutes. To be good at the puzzle took a lot of special skills – good spatial awareness, excellent hand-eye coordination and of course a desire to win. But can the data tell us what kind of students are particularly good at this puzzle?
Raw Data
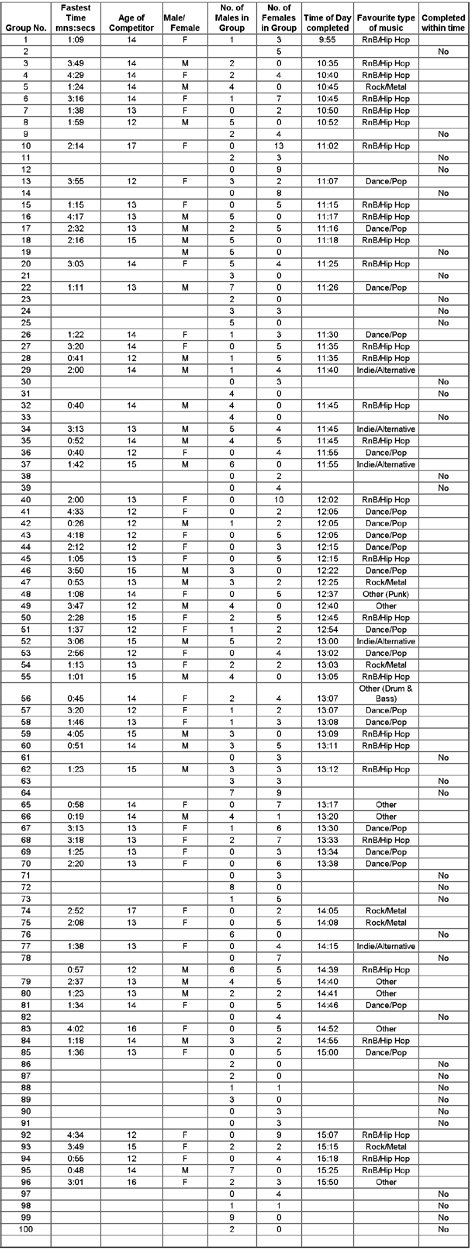
The raw data can also be downloaded as a XLS file, here.
Investigation between time of day and completing the cube
Does the time of day affect your ability to solve problems? Let’s see whether the time of day affected the students completing the cube.
1. Before you plot any data, try and make a prediction about what type of pattern you might expect to see between time of day and speed of completing the cube.
2. Plot a scatter diagram which compares time of day against the time in which the cube was completed. Make sure you think carefully about choosing the correct scale.
3. Is there any correlation between time of day and the time taken to finish the cube? If there is a correlation, draw a line of best fit on your diagram.
4. Was your prediction in question one correct?
We will now look at those groups which failed to complete the cube inside the time allotted. Will this give us any further information?
5. Fill out the following table
| Time | Number of groups
competing |
Number that failed
to do it in the time allotted. |
Percentage of ‘failures’
in the time. |
| 9am-10am | |||
| 10am-11am | |||
| 11am-12pm | |||
| 12pm-1pm | |||
| 1pm-2pm | |||
| 2pm-3pm |
6. Does the data above suggest there a possible link between not being able to complete the cube in time and the time of day?
Girls v Boys and age effects
Are boys or girls better at solving the cube? Does age have any effect?
1. Draw scatter diagrams for completion time against age for boys and for girls.
Do you think there is any difference between boys’ and girls’ performance on the puzzle?
Do you think that age is an important factor?
2. Fill out the following table to help you complete a Box and Whisker Plot
| Male Winners | Female Winners | |
| Minimum Value | ||
| Maximum Value | ||
| Lower Quartile | ||
| Median | ||
| Upper Quartile |
3. Now draw two box and whisker plots side by side on graph paper
Do you think these box and whisker plots suggest that there is any difference between the ability of boys and girls to complete the cube?
4. Look back at the data table which showed the number of boys and girls in each group. Does it seem as though one sex were over-represented as the fastest individual in mixed teams?
If so, does this make any difference to the interpretation of the earlier questions?
5. During the competition there were X groups of students where no one managed to complete the cube in under 5 minutes. Describe how having this extra unknown data could affect our result?
Music and ability
Have you ever wondered what the type of music you listen to might say about you? Some newspaper articles have suggested that a love of rock / metal music can be an indicator of being better at problem solving.
1. Fill out the following table
| Type of Music | Number of winners |
| Rock / metal | |
| Dance / Pop | |
| RnB / Hip-Hop | |
| Indie / Alternative | |
| Other |
2. Now draw a bar chart representing this data
3. Does your bar chart suggest that there is a link between taste in music and ability to solve the cube?
One drawback with the bar chart is that we don’t know how popular the different music types were amongst the students at the fair. If one music type was very popular, then it is much more likely that there were more winners who liked that kind of music.
4. Fill out the following table
| Type of Music |
Mean time taken
Median time takenRock / Metal Dance / Pop RnB / Hip-Hop Indie / Alternative Other
5. Now that you have calculated the mean and median time for each category, has your opinion changed about whether music taste affects ability?
Related Documents
Download the Cube Puzzle teaching resource