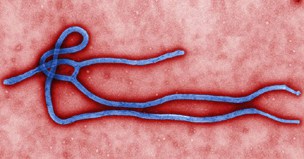
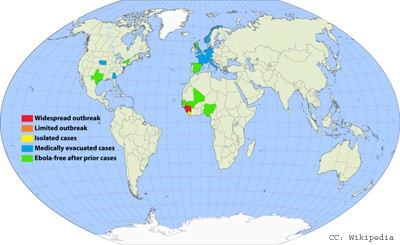
The spread of Ebola has caused more fear than any other disease in recent times. It has spread rapidly through West Africa, taking thousands of lives in Liberia, Sierra Leone, and Guinea and has even infected a few people in Europe and the U.S. What you may not realise is that when a disease starts to get out of control; mathematics plays a vital role in the battle to stop the epidemic.
If you can predict how a disease will spread, then you can take measures to prevent it. That is why mathematicians are called upon to use mathematical models to predict how an epidemic will develop.
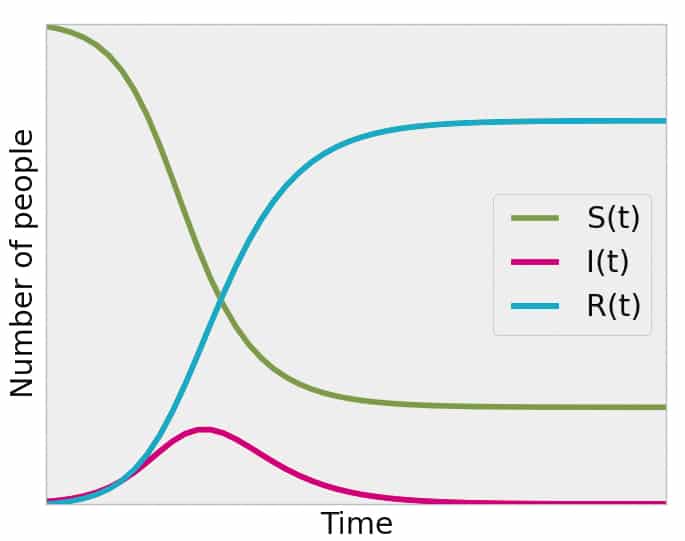 Mathematicians use models based on a simple set of equations which were developed in the 1920s called the SIR equations. The basic idea is that a population is divided into three categories. The first category consists of people who have never caught the disease before and who are susceptible. The second category consists of people who have caught the disease and are infectious. The final category consists of people who cannot catch the disease again – they have either recovered or have died. The SIR model predicts how people will move between the categories and what proportion of the population will finally catch the disease.
Susceptible (S) –> Infectious (I) –> Removed (R)
The SIR equations are a group of differential equations which model what will happen over time. To understand what they mean you will need to have studied some A-level calculus.
dS/dt = -βSI
dI/dt = βSI – λI
dR/dt = λI
 In the most basic model above, β is the rate of infection and λ is the rate of recovery. When mathematicians start to use these models, they need the help of people on the ground to collect accurate data as they need to have a good estimate for the rate of infection and also the recovery rate. Models are only as good as the assumptions on which they are based – if you use a completely inaccurate rate of infection then your model will not be useful.
There is also a special number called R0 (pronounced R nought) which is called the “Basic Reproductive Ratio”. R0 is defined as being the average number of new cases resulting from an infected individual. For example in the case of Ebola, is thought to be somewhere between 1.5 and 2.5. This means that for every infected individual, there will be around two more new people infected. Mathematicians have shown that if is ever greater than 1 then this means a disease will continue to spread whereas if is less than 1, then the disease will not continue to spread.
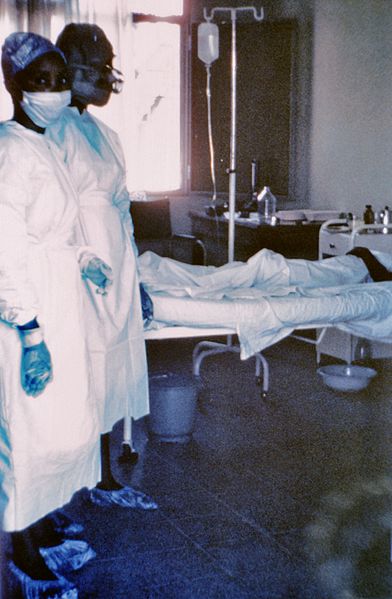
One of the challenges with Ebola is that it has been difficult to estimate accurately, as there has not always been accurate data about what is going on in the countries affected. Some people may not report infection, or doctors may be unsure how many people have died or recovered. Mathematicians also want to model lots of different scenarios, so that governments can prepare for a variety of outcomes. Mathematicians will run their models using different rates of infection taking into account how successful countries have been at isolating patients. In a worst case scenario, it was predicted that there would be 1.4 million cases by January 2015. Thankfully this didn’t happen, although at the time of writing this article, the disease is still not yet under control.
| If you are interested in using your mathematical skills in the field of epidemiology, you should consider studying a degree in mathematics or statistics, followed by postgraduate study. |
Article by Hazel Lewis