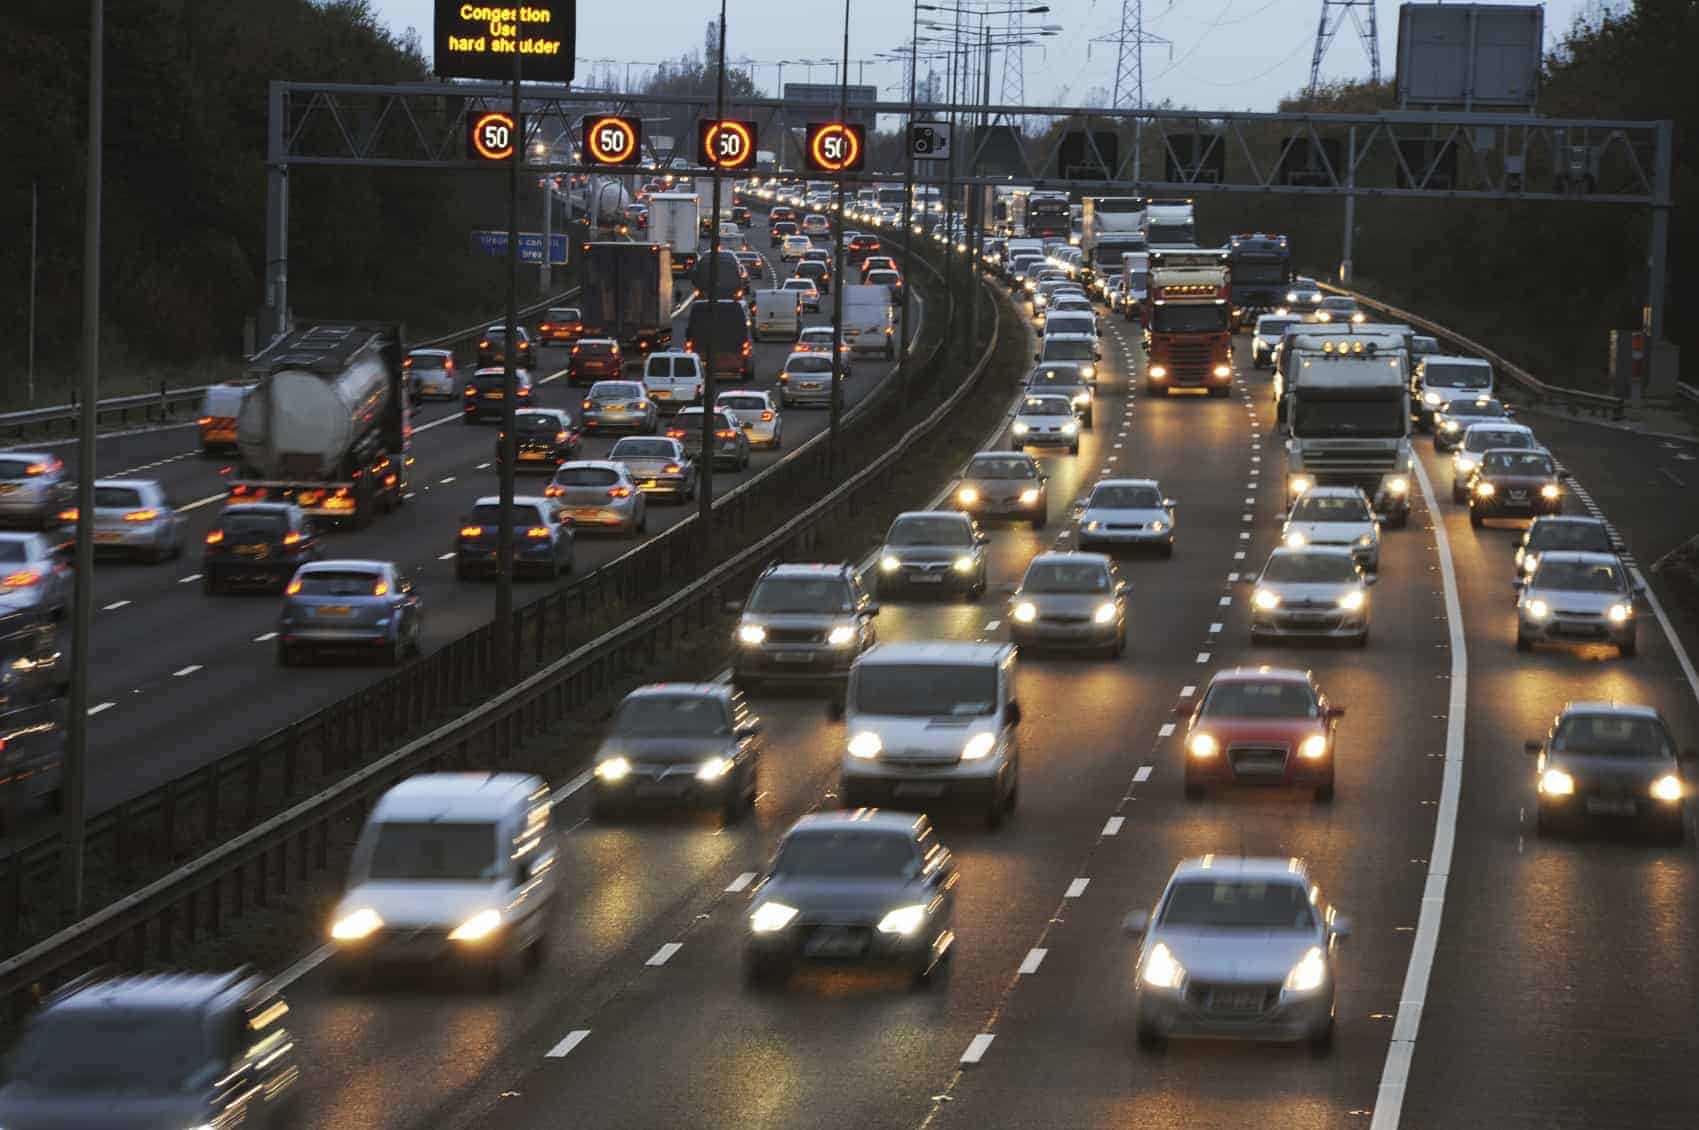
You may have encountered what are known as ‘phantom traffic jams’ when driving along the motorway.
This is when a traffic jam appears out of nowhere, before mysteriously disappearing again, without any sign of an accident or obvious cause of the jam. Phantom traffic jams are extremely frustrating and lots of mathematical research has been done to find out their cause and possible solutions.
In order to manage motorways effectively wires have now been buried every 500 metres under the surface of the road, which count the cars as well as measuring their speeds. Next time you are on a motorway see if you can spot these buried wires which appear as black rectangles on the road surface. (Assuming that you are a passenger of course!)
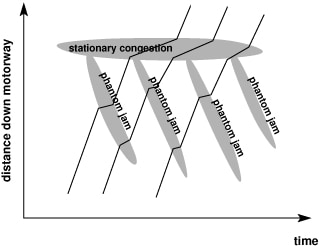
This information allows researchers to build up a detailed picture of what is actually happening on a motorway. Researchers can plot a distance time graph showing how cars are behaving on the motorway.
In the diagram below each line represents one car travelling along the motorway, and the steeper the slope, the faster the car is travelling. At the top of the diagram you can see congestion which is caused by something like a massive inflow of cars at a busy junction. Below this you can see that each car is encountering a mini phantom traffic jam at different points on the motorway.
Researchers have found that these phantom traffic jams travel in waves backwards down a motorway, usually at a speed of around 15-20 kilometres per hour. Phantom traffic jams can travel for up to 100km along a motorway! Researchers in Japan have conducted an experiment where they got cars to drive steadily around a circular track. Before long phantom traffic jams were developing as you can see in this video:
One way researchers model the traffic is to treat it like a gas, where each car is modelled as a molecule of gas. This enables researchers to use equations about how gas flows down pipes.
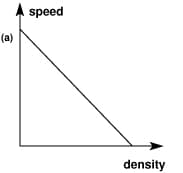
The graph below shows how speed and density are related. When cars are densely packed in on a motorway, their speed is low, as cars drive slower in order not to crash into one another. When on the other hand the density of cars is low, then cars can drive faster as there aren’t many cars around to get in their way.
The next graph shows how flow rate and density are related. (Flow rate is number of cars passing a given point in a given time.) We want to maximise the flow rate, as this will mean more cars will be able to travel down the motorway. The relationship between flow rate and density is an upside down quadratic graph.
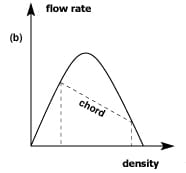
When the density of cars is low, then flow rate is low as few cars are travelling down the motorway. When density of cars is very high then flow rate is also low as traffic jams will develop and few cars will be flowing down the motorway. Studying these graphs has led to Highways England introducing what are known as ‘Smart Motorways’.
In busy conditions the speed limit on the motorway is gradually reduced down to 60mph and then 50mph. Next time you are on a motorway watch out for this happening. When speeds are reduced, then according to graph a) the density of traffic should increase. Then looking at graph b), if density increases it should lead to a greater flow rate. (As long as you don’t increase it too much!)
It goes against common sense to think that reducing the speed of traffic increases the flow rate, but that is what the mathematics has shown us and it is backed up by what is observed happening on actual motorways. There are however still many things which researchers still don’t understand about phantom traffic jams and it is an active area of ongoing research which many people are working on.
If you are interested in a career in traffic modelling or transport planning then most people complete postgraduate study to gain entry into this area. If you are interested in traffic modelling then an undergraduate degree in engineering, mathematics, physics or computer science would be useful.
Article written by Hazel Lewis
Adapted from a piece written by Eddie Wilson in 50 Visions of Mathematics