
The use of charts and graphs can provide succinct and immediate features of mathematics in a form difficult to achieve with words.
Do not use words when a table or diagram would show your ideas better, and refer to them in the text.
For example “Figure 2 shows the current trend, from which we see … “.
Equations should be read as part of the text and properly punctuated and numbered e.g.

Be aware that figures can be highly misleading, see e.g. “How to lie with statistics” D. Huff, Penguin 1991. You need to choose the most appropriate form of diagram for your data, or perhaps show the data plotted in two separate ways to stress different points. Deciding which type of chart to use may require discussion with your lecturer, otherwise a good place to start is Wikipedia.
For effective communication of mathematical meaning you should keep the following in mind:
- Histogram are like bar charts but stress the area of each column which needs to be accounted for when displaying unevenly grouped data by varying the column widths and heights. The area scale should be stated in the caption and a square depicting 1 (or 10, 100, …) measured units should be drawn on the figure. Data with no upper (or lower) limit such as >1000kg should not be placed on the histogram, but should be stated in the caption.
- With linear graphs, be very careful if you use different scales for the x and y axis as this will distort the graph, so that e.g. a slope of 1 will not look like 45 degrees and this will convey a misleading impression of either weak or strong dependence of the y variable on the x variable. Similar distortions occur when using the origin not at (0,0) or if the data ranges are not contiguous; both cases must be clearly marked on the axes with a break symbol or dotted line.
Log graphs are often misleading. Be clear about the following.
- Log graphs never have data at the origin and cannot be used for negative data.
- On a log-log graph, a datum point of (1,1) will be plotted at (0,0) since log(1) = 0,
- x & y data between 0 & 1 will be plotted in negative quadrants (since log(p) is negative if p is between 0 and 1),
- Data will be greatly compressed for large x (e.g. 10^6 is plotted at 6 and a million times larger 10^12 is plotted at 12), whereas data will be greatly expanded for small x (e.g. 10^-6 is plotted at -6 and a million times smaller 10^-12 is plotted at -12). Thus log to base 10 scales are often useful for depicting data covering a wide range such as the diameter of a molecule to the size of the Milky Way (-12 to 22 on a log base 10 scale when measured in metres).
As an aside, have a look at this web site on sizes of different objects: my daughter described this as the coolest thing ever – I agree! - Moreover if y = kx^m where k and m need to be determined from the data, then a log-log graph of Y=log(y) against X=log(x) will give the straight line Y= mX + C where the constant C=log(k) and the slope m can be measured from the plot.
Label the figure and each axes with the variable name and units, and mark the scales clearly. Finally all tables, diagrams and figures must have a self-explanatory caption so that they can be understood without reading the text by someone broadly familiar with the subject.
It is usually much better to include figures straight from other software (e.g. Excel, Mathematica, etc.) or drawing packages in the document via the clipboard; this makes managing and printing the document much easier. If you do need hand drawings, photos etc. you should scan them in and include them as imported pictures in the word processed report.
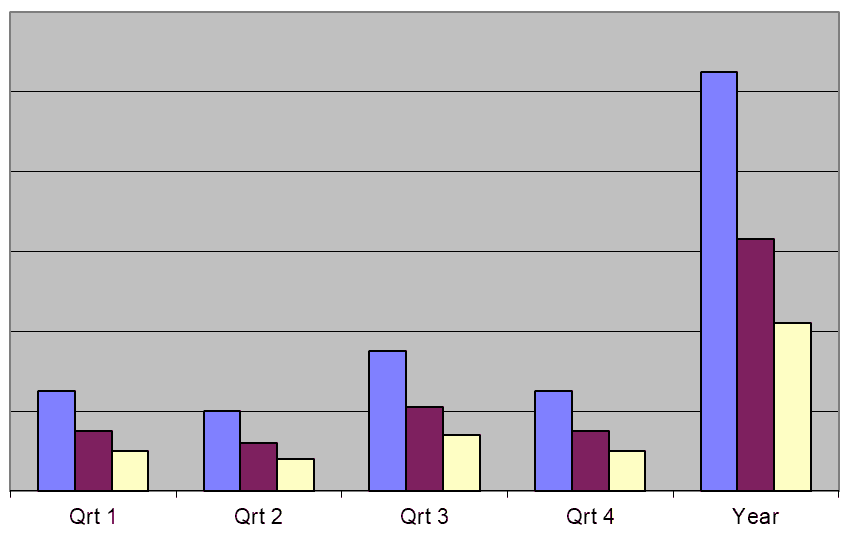
This is an example of a bad bar chart; it has no title, no scale or axes titles and no legend.
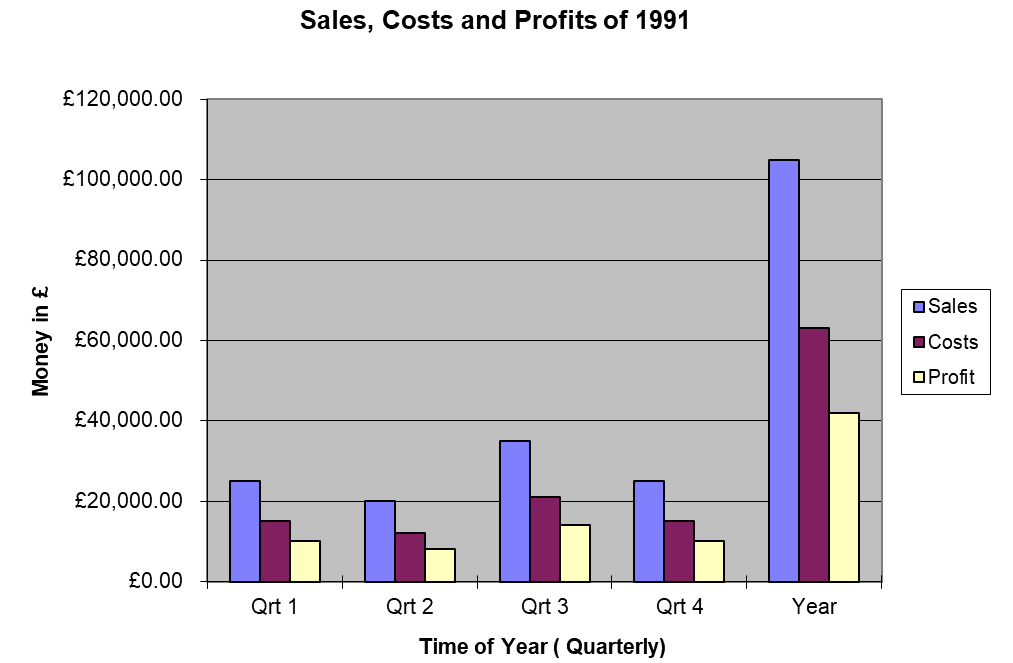
This is an example of a good bar chart; it has titles, scales and a legend.
Always use S.I. units and standard form e.g. or
or  (not metres per sec per sec or m per sec squared etc.).
Learn the following notation:
G giga 
M mega 
k Kilo 
d deci 
c centi 
m milli 
 micro
micro 
About the Study Skills pages
These pages were originally created by Martin Greenhow.

Study Skills by Martin Greenhow is licensed under a Creative Commons Attribution-NonCommercial-NoDerivatives 4.0 International License.
Study Skills – Time Management
Study Skills – Projects and Essays
Study Skills – Using Charts and Graphs
Study Skills – Postgraduate Research
Featured Image by William Iven on Unsplash