Have you ever tried to walk down a busy street, constantly jostled around by people in the crowd? It takes much longer to get where you’re going, because you keep getting pushed back in the wrong direction. This kind of motion doesn’t just show up on crowded pavements though; the movement of molecules, share prices, and more can all be described by a mathematical model called a random walk.
A stroll down memory lane
The study of random walks began in 1827, when botanist Robert Brown was using a microscope to examine grains of pollen suspend in water. He noticed that the grains appeared to constantly move around as if they were alive, but when he observed the same effect with lifeless dust particles he realised there must be another explanation. Brown never worked out the answer, but the strange phenomenon became known as “Brownian motion” in his honour.
The mystery remained until 1905, when Albert Einstein realised the pollen grains were being pushed around by invisible particles – a discovery that helped prove the existence of atoms and molecules. In the same year, the statistician Karl Pearson introduced the phrase “random walk” when he asked a question in the journal Nature. He imagined a man walking a fixed distance in a straight line before turning in a random direction and walking the same distance again. After repeating the process a certain number of times, where would the man be in relation to the start? It turns out the same kind of maths describes both problems.
Walking in one dimension
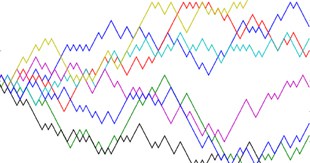
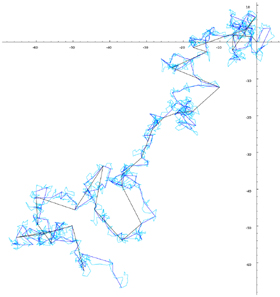
Pollen grains move in three dimensions, and Pearson’s hypothetical man in two, but the simplest random walk is one-dimensional. Imagine you’re standing at 0 on the number line, with positive and negative numbers stretching out to infinity in both directions. You flip a coin to decide where to go next. If it’s heads, you move up one space to the number 1, and if it’s tails, you move down one to -1. Flip again, and move up or down another space. If you keep going, where will you end up?
Suppose after N flips you’ve take n1 steps to the right and n2 to the left. The distance you’ve travelled depends on the exact number of steps in each direction, or in other words how many heads and tails you got. The probability of getting n1 heads and n2 tails is just (pn1)(qn2), where p and q are the probability of getting either heads and tails respectively. For a fair coin, p = q = ½, so
(pn1)(qn2) = (1/2)n1 + n2 = (1/2)N.
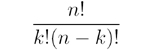
This doesn’t take into account the number of different sequences of coin flips with exactly n1 heads and n2 tails though. For that we need the binomial coefficient ![]() , or “n choose k”, which is
, or “n choose k”, which is
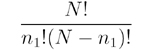
In this case we’re choosing n1 heads from N flips, so the coefficient is
That means the distribution of n1 is
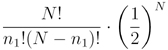
but this is just a binomial distribution, so the average number of steps to the right is p·N, and to the left is q·N. Again, for a fair coin these are the same; p·N = q·N = N/2. We’re interested in the distance travelled after N steps, which is dN = n1 – n2, and that means the average of dN is the average of n1 – n2 = N/2 – N/2 = 0.
In other words, on average each step to the right is cancelled out by one to the left, and you end up at zero. That’s not a very useful calculation, so instead we can ask how much dN will usually vary from the average of zero by working out the average of (dN)2. It turns out to be N, which means the absolute distance travelled will usually be around ?N – check out MathWorld for a full explanation. The same result applies in higher dimensions as well – after a random walk of N steps, you end up about ?N from where you started.
Random walks in the real world
Whether in one, two, or three dimensions, random walks are widely used to model situations in science and business. Random walk theory in the financial markets suggests the past performance of a company’s stock can’t be used to predict its future performance, so share prices will go up and down in a one-dimensional random walk. Ecologists model animals as using two-dimensional random walks to forage for food, and Brown’s jostling pollen grains are the classic example of a three-dimensional random walk. That’s the nice thing about maths – one simple idea can have hundreds of applications.