Climate change could be make-or-break time for our species. The world’s climatologists agree that planet Earth is heating up, and most of them also agree that this is due to human activity. Rising temperatures and sea levels are already threatening low-lying islands such as the Maldives. Ecosystems are being disrupted, with animals dying out or migrating to new habitats. In the future, the impact on us could become more direct, as crop yields drop and low-lying towns flood.
Indicating change
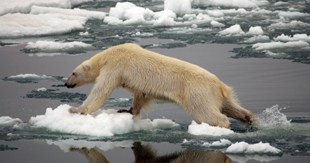
 The shrinking icecaps around the poles are both an indicator of the situation, and one of the key players in the planet heating up. As the planet warms, white ice melts, making the Earth’s surface darker. This means that more sunlight is absorbed rather than reflected, raising the temperature and melting more ice. Tiny changes can make a big difference here. If the ice sheets became just 0.1% thinner, global sea levels would rise by 8.3 cm. It’s vital to know the current state of the ice at the poles – both on land and sea – to check the planet’s health.
Satellites are very important for performing planetary health checks. Maths is crucial in building and launching satellites. The sensitive instruments these satellites carry are designed using maths, insulated from forces that mathematicians have calculated, and tested using statistical analysis. Trigonometry is used to work out their launch angle, and calculus to find their trajectory into orbit. Once deployed, they provide information on both the area and thickness of the ice caps. Due to their remoteness and uniform terrain, these regions are poorly mapped. Mathematicians design algorithms to sort the vast amounts of data and then to process the images, and create more detailed maps. Lidar measurements – like radar, but using light – measure the distance from the satellite to the ice surface so accurately that changes of just 1.5 cm a year can be detected. These two sources of information allow climatologists to see how the regions are changing with time.
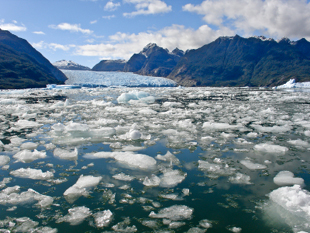
 Even with the best data that satellites can provide, many important details of ice structure are just too small to be seen. Sea ice is particularly complicated, because it is porous and varies from place to place. To fill in the gaps in the satellite information and predict future changes, mathematicians try to understand its properties at the scale of individual ice floes – and smaller. It is useful to know how easy it is for heat and fluids to travel through solid sea ice, as well as how it breaks up when buffeted by winds, currents or other floes.
Using models
Modelling this situation draws on many branches of maths. The large variations in sea ice thickness is best treated using probability and statistics. Differential equations are used to evolve the situation forward and backward in time. Add to that the computational methods required to run these simulations, and the electrical and mechanical engineering needed to get the initial data, and there is a lot more maths in climate change than you might think. Mathematicians are an important part of the scientific team working for our future.
The NASA/Goddard Space Flight Center – Scientific Visualization Studio shows an animation of the sea ice minimum concentration for 1979–2005.