The heart shape is one of the most well-known symbols of love throughout the world. But what is the equation of a heart? Don’t be content with drawing a traditional heart on your Valentine’s Day card – instead you could try using one of these equations.
The Cardioid
One of the most famous mathematical heart shapes is the cardioid. This shape was named after the Greek word for heart, which also gives rise to words such as cardiologist (heart doctor).
Cardioids can be made in a number of different ways. However, the most well-known is by taking a circle and then rolling another circle of the same radius around its circumference. If you track a point on the circumference of the outer circle it will trace out the shape of a cardioid.

Epicycloids
A cardioid is a special case of what is known as an epicycloid. For a cardioid, the inner and outer circles have the same radius. If the two circles have different sized radii then it is possible to generate many other epicycloids. For example, if the inner circle has a radius which is three times the outer circle, then you will generate a totally different shape. This is very pretty, but not very useful for your Valentine’s Day card.

The Cardioid Equation
The equation for the cardioid in Figure 1 is as follows: 
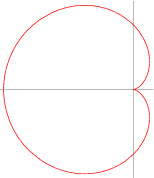
Figure 1: A Cardioid
This cartesian equation has a nice symmetry, but it also not the most common way to express the equation for a cardioid. Most people use what are known as polar coordinates. In polar coordinates two pieces of information are given:  .
.  is the radius from the origin.
  is the angle travelled from the origin in an anti-clockwise direction. When we have these two pieces of information, it is possible to plot exactly where a pair of coordinates lies in the plane. (This is usually plotted on a computer, but you could use a diagram such as that in Figure 2.)
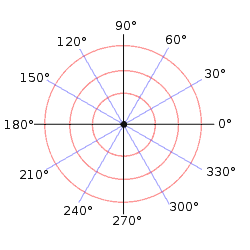
Figure 2: A diagram which is used for plotting with polar coordinates.
Using polar coordinates makes the equation for a cardioid much simpler. The polar equation for the cardioid curve in Figure 1 is: 
If you want to turn your heart the right way up then it will have the polar equation 
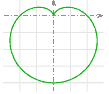
Figure 3: An upright cardioid
Cardioids generated using light
A cardioid can also be generated by placing a light source shining inwards from the perimeter of a circle. The rays will reflect within the circle forming tangents to a cardioid. If a cardioid is formed in this way, then it is what is known as the ‘caustic of a circle’.
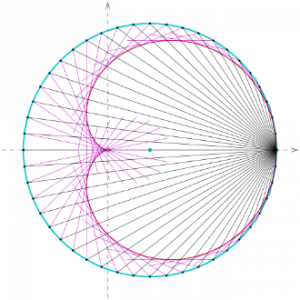
Figure 4: A cardioid formed by shining a light source inside a circle.
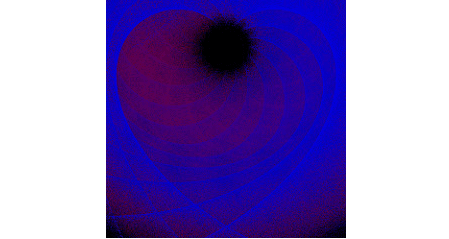
This method of generating a cardioid can be replicated in real life. For example you may have seen a cardioid form inside your coffee cup:

Figure 5: A cardioid appearing inside a coffee cup
The cardioid has many fascinating properties, however its one drawback is that it doesn’t completely look like our traditional image of a heart. If you want to plot a much more standard looking heart then you might want to try typing the following into the google search bar (you may not have realised until now that the google search bar has a graphing function!):
sqrt(cos(x))*cos(400*x)+sqrt (abs(x))-0.4)*(4-x*x)^0.1
This results in the following heart shape:
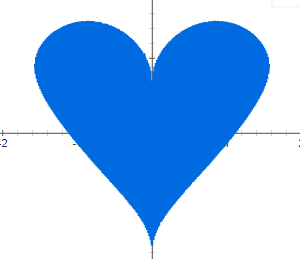
Figure 6: Heart generated by typing equation into google
This certainly results in a better looking heart shape, however it is not anywhere as mathematically interesting as the cardioid, and it certainly doesn’t appear spontaneously in nature like the cardioid does.
Who knows, maybe you will dispense with the traditional Valentine’s Day card altogether and send your loved one a link to GeoGebraTube.
Article by Hazel Lewis
image credit Without You by fractalken@Flickr